Golang and Memory
Jul 28, 2020Golang is a static language with GC, which helps a lot in memory management. But memory leak is still very likely to be produced if the program allocates too many objects and doesn’t release the references to them in time.
Recently we met some memory leaks when implementing the parallel graph chains in Mixin Kernel. Golang has lots of powerful tools, among them pprof is the one to profile Go programs, and there are two simple ways to utilize it.
If you are using the standard testing package, you need to do nothing but set the -memprofile flag when run the tests, then you get a file for profiling the memory.
go test github.com/MixinNetwork/mixin/kernel -memprofile mem.prof
go tool pprof mem.prof
And if your program is a long running daemon, then it’s good to import the net/http/pprof package to enable runtime profiling.
package main

import (
	"net/http"
	_ "net/http/pprof"
)

func main() {
	http.ListenAndServe(":12345", http.DefaultServeMux)
}
Then you can get a memory profile output at anytime by making a simple HTTP call.
curl http://localhost:12345/debug/pprof/heap > mem.prof
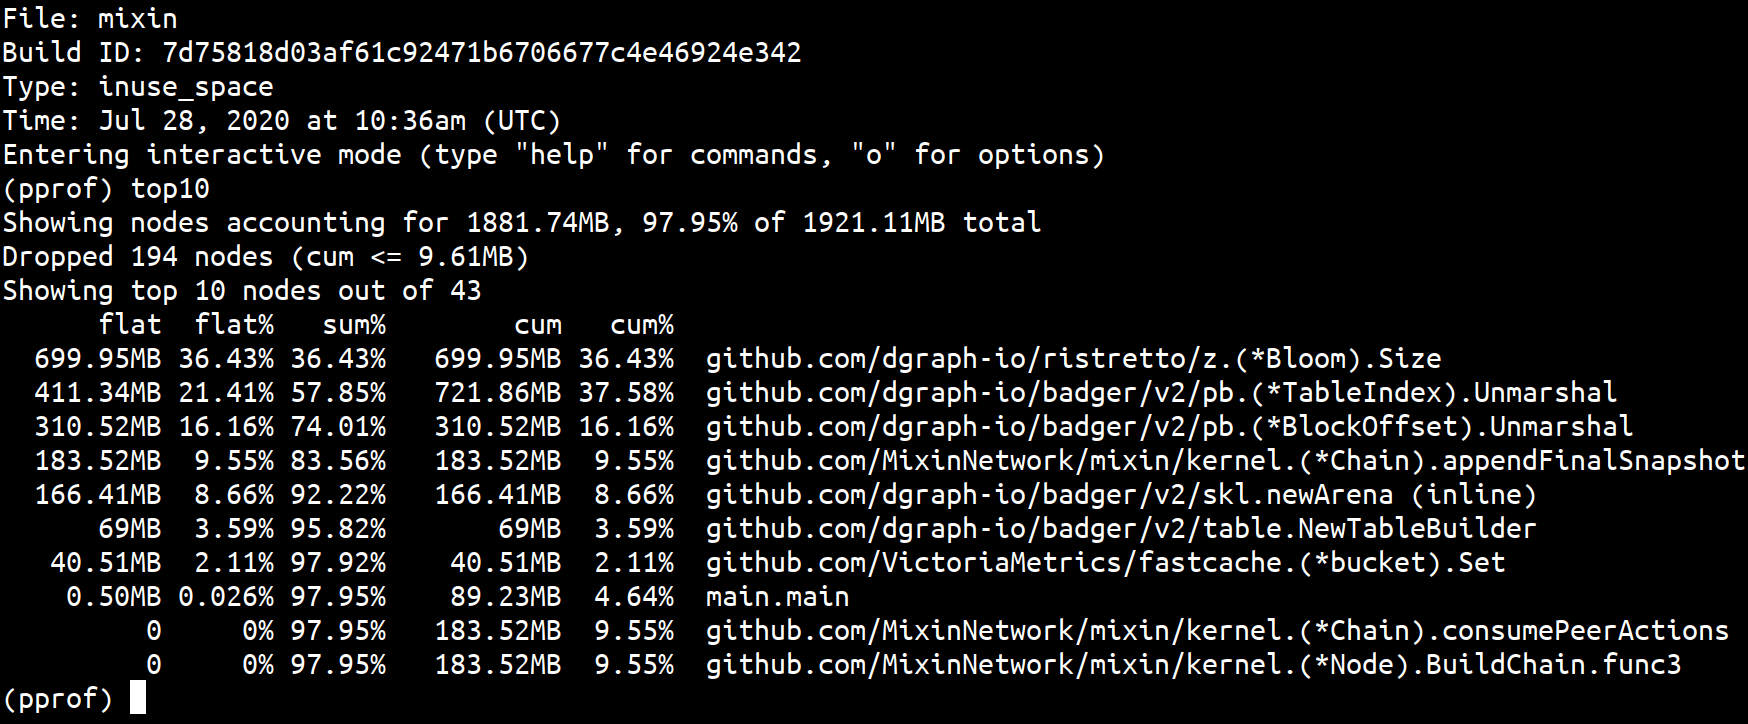
go tool pprof mem.prof
And the top memory usage of an archiving only Mixin Kernel node shows that the program only uses 1921.1MB memory. And of course it’s the result of fixing the issues by profiling.
Now the weird things happen, when pprof shows no obvious memory leaks, the top command suggests my program keeps eating memory.

That 0.011t RES is a huge 11GB memory usage compared to the 1921.1MB usage showed by pprof, and it keeps increasing all the time. Although it never gets killed by Linux kernel OOM, I’m still confused a lot. And I tried to add a convenient RPC call to debug.FreeOSMemory, the method correctly returned but no usage decrease in the top RES field.
Finally after made a lot of searches I’m confident that the cause is the MADV_FREE flag. Whenever the Golang GC wanna free some memory back to the OS, it utilizes the MADV_FREE flag for Linux 4.5+, whenever Linux kernel receives this flag, it won’t release the memory instantly, neither does it reduce a process’s RSS until the system is actually under memory pressure. Then I change the default memory free flag from MADV_FREE to MADV_DONTNEED by setting the environment variable GODEBUG=madvdontneed=1 when starting my program. The RES continues growing as before but a call to FreeOSMemory now reduces the number successfully.
Now another confusion comes, the top or free command still shows that my program occupies about twice of the amount of memory showed by pprof. After read through some docs on Golang GC mechanism I know it’s the garbage collection target percentage controlled by the GOGC variable, the default value is 100, which means that a collection is triggered when the ratio of freshly allocated data to live data remaining after the previous collection reaches 100%. To prove I’m correct I set GOGC to 200, then the system always shows about three times of the memory by pprof.
To conclude, though the top command shows a continually increasing RES about my program, there is no memory leak at all. And this behavior could be modified by tuning the MADV_FREE and GOGC flags.
References